
Centrope in Figures
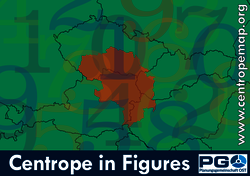
Centrope in Figures is an annually updated collection of print-ready thematic maps in DIN A3 format featuring data and indicators from CentropeMAP's cross-border statistical database. Proceed to the download page of Centrope in Figures or download all sheets at once (ZIP, 41 MB).
Contents
- Table of Contents (PDF, 1 page, 38 kB)
Section 0 – Overview
- Sheet 0.01.06 – Centrope at a glance 2022 (PDF, 1 page, 700 kB)
Section 1 – Population Development
- Sheet 1.01.06 – Population development 2012–2022 (PDF, 1 page, 4 MB)
- Sheet 1.02.06 – Population density 2022 (PDF, 1 page, 4 MB)
- Sheet 1.03.06 – Population aged younger than 15 years 2022 (PDF, 1 page, 4 MB)
- Sheet 1.04.06 – Change of population aged younger than 15 years (PDF, 1 page, 4 MB)
- Sheet 1.05.06 – Super-aged Centrope? (PDF, 1 page, 4 MB)
- Sheet 1.06.06 – Ageing of Centrope’s population (PDF, 1 page, 4 MB)
- Sheet 1.07.06 – Old age dependency ratio 2022 (PDF, 1 page, 4 MB)
- Sheet 1.08.06 – Economic dependency ratio 2022 (PDF, 1 page, 4 MB)
Section 2 – Economic activity
- Sheet 2.01.06 – Working age population 2022 (PDF, 1 page, 4 MB)
- Sheet 2.02.06 – Working age population change 2011-2022 (PDF, 1 page, 4 MB)
- Sheet 2.03.01 – Unemployment rate 2011 (PDF, 1 page, 4 MB)
- Sheet 2.04.01 – Inbound commuting 2011 (PDF, 1 page, 4 MB)
- Sheet 2.05.01 – Outward-bound commuting 2011 (PDF, 1 page, 4 MB)
Sheets of previous editions can be found in our archive.