Map of the month October 2025: International Day of Older Persons
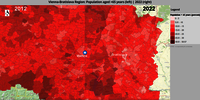
International Day of Older Persons takes place annually on 1 October and was established by the United Nations General Assembly in 1990. It aims to draw attention to the challenges and needs of older persons, combat age discrimination and promote intergenerational solidarity. On this occasion we take a look at the development of older population (aged >65) over time in the Centrope region. The comparison shows data from 2012 and 2022. Slider maps are available for the surroundings of the larger cities in the region:
Open Map for Vienna-Bratislava region

Map of the month September 2025: School starts
Every September school is starting again after the summer holidays. Where is the most demand of primary schools in the Centrope region? To get an overview about that, we can use the percentage of 5 to 9 year old children in relation to the total population as approximated value. We can see a higher percentage of 5-to-9-year-old children along the Danube from around Bratislava to the West of Lower Austria as well as in and around the bigger cities in the Czech area, České Budějovice, Jihlava and Brno. The percentage of 5-to-9-year-old children is amaller in the North of Lower Austria and in the Burgenland/Hungary area. The map is available through our geoportal map.centropemap.org

Map of the month August 2025: World Lake Day
On the occasion of World Lake Day, which takes place on 27 August, we take a look at water bodies and water courses in the Centrope region. The comparison shows Corine Land Cover data from 2000 and 2018. The 2018 layer also shows the built-up area 2000–2014 from the Global Human Settlement Layer. Slider maps are available for the surroundings of the larger cities in the region:
Open Map for Bratislava region

Map of the month June 2025: Imperviousness Comparison 2009 – 2018
On the occasion of World Environment Day (5 June) we are going to take a look at the changes in imperviousness in the Centrope region. The comparison is done using satellite-image-based data layers from the European Environment Agency. Imperviousness, i.e. the covering of soil with non-permeable materials such as concrete or asphalt, has a significant impact on the climate. It reduces the soil's ability to store carbon and absorb water, which can lead to higher temperatures in cities and an increase in flooding risk.

Map of the month April 2025: Tree Cover Density Comparison 2012 – 2018
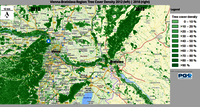
This month we are going to take a look at the changes in tree cover density in the Centrope region. The comparison is done using the tree density cover layer from the European Environment Agency, which is a satellite-based evaluation of the tree top cover. The coverage of the ground by trees and their tops is displayed continuously from 0 to 100 %. The comparison shows that between 2012 und 2018 the tree cover became denser. However, if you closely look at smaller spots, many of them seem to have disappeared, which can be interpreted as a sign of progressive soil sealing. Some changes may also have occurred due to differences in automatic image interpretation due to season and weather condition at the time of satellite image generation.
Open Map for Vienna-Bratislava region

Map of the month February 2025: Corine Land Cover Comparison 2000 – 2018
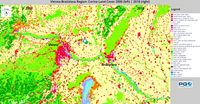
This month we are going to take a look at the changes in land use in the Centrope region. The comparison is done using Corine Land Cover, which is a satellite-based land use map showing real land use in 34 different categories. The comparison shows that between 2000 und 2018 urban areas became denser and also some smaller villages underwent some slight changes in size. However, the overall land use in the past 20 years did not change much. Some changes between adjacent categories (one up or one down in map legend) may also have occurred due to differences in automatic image interpretation due to season and weather condition at the time of satellite image generation.
