
Map of the month April 2026: Tree cover density
Tree cover density impacts ecosystems and urban areas by regulating temperature, improving air quality, enhancing biodiversity, and reducing noise. Higher density typically enhances environmental benefits, such as lowering urban heat, but excessive density in specific biomes can hinder biodiversity and increase vulnerability to storm destruction. The slider maps compare the years 2012 and 2021.
Open Map for Vienna-Bratislava region
Open Map for Győr-Neusiedl region

Map of the month March 2026: International Day of Luck
20 March is the international day of luck. Isn't it a piece of luck if there are green areas near your home? Several studies show that people living near natural areas, parks or trees enjoy a higher quality of life, experience less stress and have better mental health. The tranquillity and natural surroundings have a calming effect and promote well-being. To visualise this, green and natural areas from Urban Atlas 2012 are combined with the built-up structure from the Global Human Settlement Layer. Open our geoportal map.centropemap.org to view this map.

Map of the month February 2026: Old age dependency ratio
The old-age dependency ratio measures the number of elderly people (aged 65+) per 100 individuals of working age (15-64), highlighting the demographic burden on the workforce. The numbers show an increase from 2014 to 2024 throughout the whole Centrope region, which is a significant indicator for the ageing of the whole population, despite having a higher ratio of younger people in Slovakia, for example. All exact numbers and time series data from 2008 to 2024 can be retrieved from our cross-border database on municipality level.
Open Map for Vienna-Bratislava region

Map of the month December 2025: World Soil Day
World Soil Day is an international day of action on 5 December. It was designated by the International Union of Soil Sciences (IUSS) at its 17th World Congress in Bangkok in August 2002. On this occasion, we are taking a look at the development of imperviousness in the Centrope region, comparing data from 2006 and 2018. Slider maps are available for the surroundings of the larger cities in the region:
Open Map for Vienna-Bratislava region

Map of the month October 2025: International Day of Older Persons
International Day of Older Persons takes place annually on 1 October and was established by the United Nations General Assembly in 1990. It aims to draw attention to the challenges and needs of older persons, combat age discrimination and promote intergenerational solidarity. On this occasion we take a look at the development of older population (aged >65) over time in the Centrope region. The comparison shows data from 2012 and 2022. Slider maps are available for the surroundings of the larger cities in the region:
Open Map for Vienna-Bratislava region

Map of the month August 2025: World Lake Day
On the occasion of World Lake Day, which takes place on 27 August, we take a look at water bodies and water courses in the Centrope region. The comparison shows Corine Land Cover data from 2000 and 2018. The 2018 layer also shows the built-up area 2000–2014 from the Global Human Settlement Layer. Slider maps are available for the surroundings of the larger cities in the region:
Open Map for Bratislava region

Map of the month June 2025: Imperviousness Comparison 2009 – 2018
On the occasion of World Environment Day (5 June) we are going to take a look at the changes in imperviousness in the Centrope region. The comparison is done using satellite-image-based data layers from the European Environment Agency. Imperviousness, i.e. the covering of soil with non-permeable materials such as concrete or asphalt, has a significant impact on the climate. It reduces the soil's ability to store carbon and absorb water, which can lead to higher temperatures in cities and an increase in flooding risk.

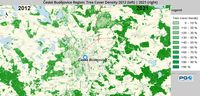
Map of the month April 2025: Tree Cover Density Comparison 2012 – 2018
This month we are going to take a look at the changes in tree cover density in the Centrope region. The comparison is done using the tree density cover layer from the European Environment Agency, which is a satellite-based evaluation of the tree top cover. The coverage of the ground by trees and their tops is displayed continuously from 0 to 100 %. The comparison shows that between 2012 und 2018 the tree cover became denser. However, if you closely look at smaller spots, many of them seem to have disappeared, which can be interpreted as a sign of progressive soil sealing. Some changes may also have occurred due to differences in automatic image interpretation due to season and weather condition at the time of satellite image generation.
Open Map for Vienna-Bratislava region

Map of the month February 2025: Corine Land Cover Comparison 2000 – 2018
This month we are going to take a look at the changes in land use in the Centrope region. The comparison is done using Corine Land Cover, which is a satellite-based land use map showing real land use in 34 different categories. The comparison shows that between 2000 und 2018 urban areas became denser and also some smaller villages underwent some slight changes in size. However, the overall land use in the past 20 years did not change much. Some changes between adjacent categories (one up or one down in map legend) may also have occurred due to differences in automatic image interpretation due to season and weather condition at the time of satellite image generation.