CentropeMAP je přeshraniční geoportál Rakouské asociace pro plánování východ (PGO), který poskytuje plánovačům, rozhodovacím orgánům, výzkumným pracovníkům, učitelům, studentům a všem dalším zájemcům lepší přehled o regionu Centrope.
CentropeSTATISTICS je výkonné rozšíření geoportálu, které umožňuje uživatelům vytvářet mapy, grafy a animované grafiky ze statistických údajů na úrovni obcí pomocí několika kliknutí myší.
*) Nefunguje správně? Upravte nastavení vyskakovacího okna tak, aby nebránilo otevření nového okna prohlížeče na stránce www.centropemap.org.
Chart of the month July
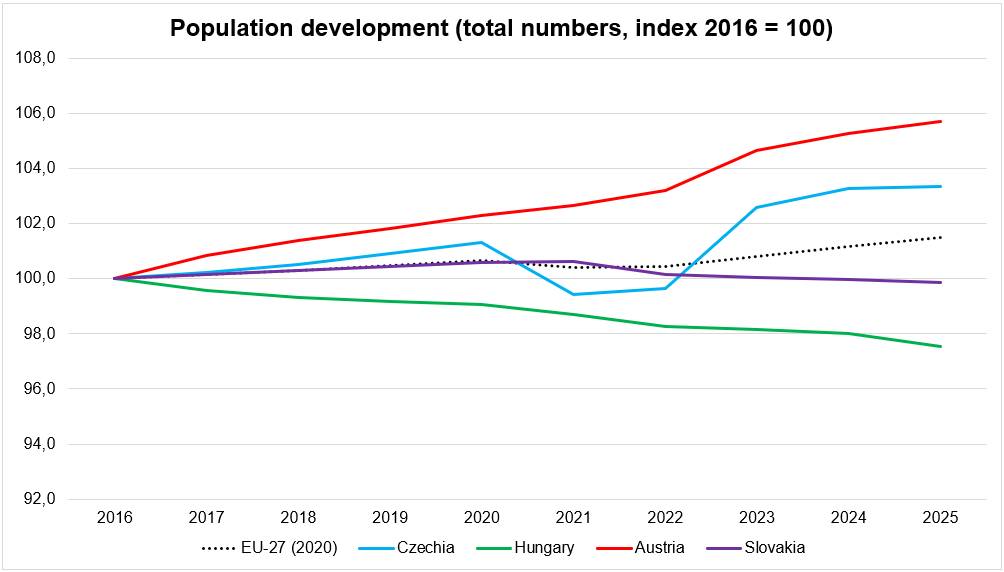
On the occasion of World Population Day, celebrated on 11 July, we are taking a look at the population development in the Centrope countries. The timeseries shows the development since 2016. Due to the differnt population size in each country, we indexed the numbers to 2016 = 100 for a better comparison. The chart shows different trends in each country: Whereas the overall population in Hungary and Slovakia is shrinking, there are increasing numbers in the Czech Republic and in Austria. The EU-27 average shows a very small increase through the decade displayed.
Data source: https://ec.europa.eu/eurostat/databrowser/view/demo_pjan/default/table
Map of the month July
11 July is World Population Day. This day of action has been observed since 1989 and is intended to encourage people to take a critical look at the growth of our population and its global implications. As well as highlighting the current situation, it also draws attention to the problems that such growth inevitably gives rise to. On this occasion, we are depicting population density (inhabitants per square kilometre) in the Centrope region. The map clearly shows the urban agglomeration areas and its surroundings. Also note the higher population density on the main traffic axes west and south of Vienna.
Open our geoportal map.centropemap.org to view this map.
Chart of the month June
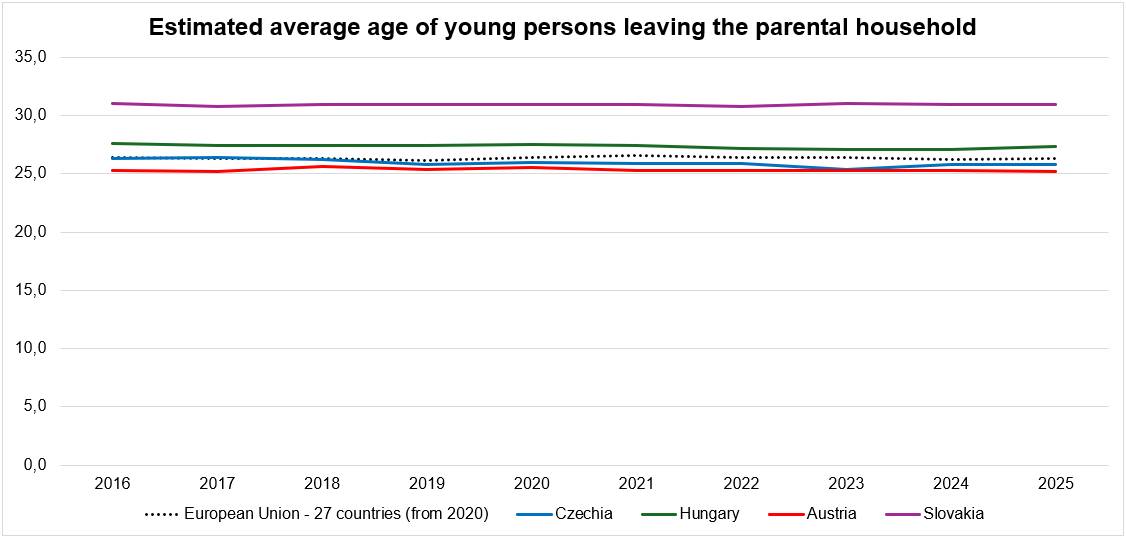
On the occasion of International Day of Parents, celebrated on 1 June, we are taking a look at average age of young persons leaving the parental household. The indicator represents the age at which 50 % of the population no longer live in a household with their parent(s). The data is coming from the EU labour fource survey (EU-LFS), which is the largest sample survey of European households or individuals. The chart shows stable figures over the last 10 years, both in each of the Centrope countries and in the pan-European average. Interestingly, the figures are highest for Slovakia, which has the youngest average population age within Centrope. Data source: https://ec.europa.eu/eurostat/databrowser/view/yth_demo_030/default/table
Map of the month June
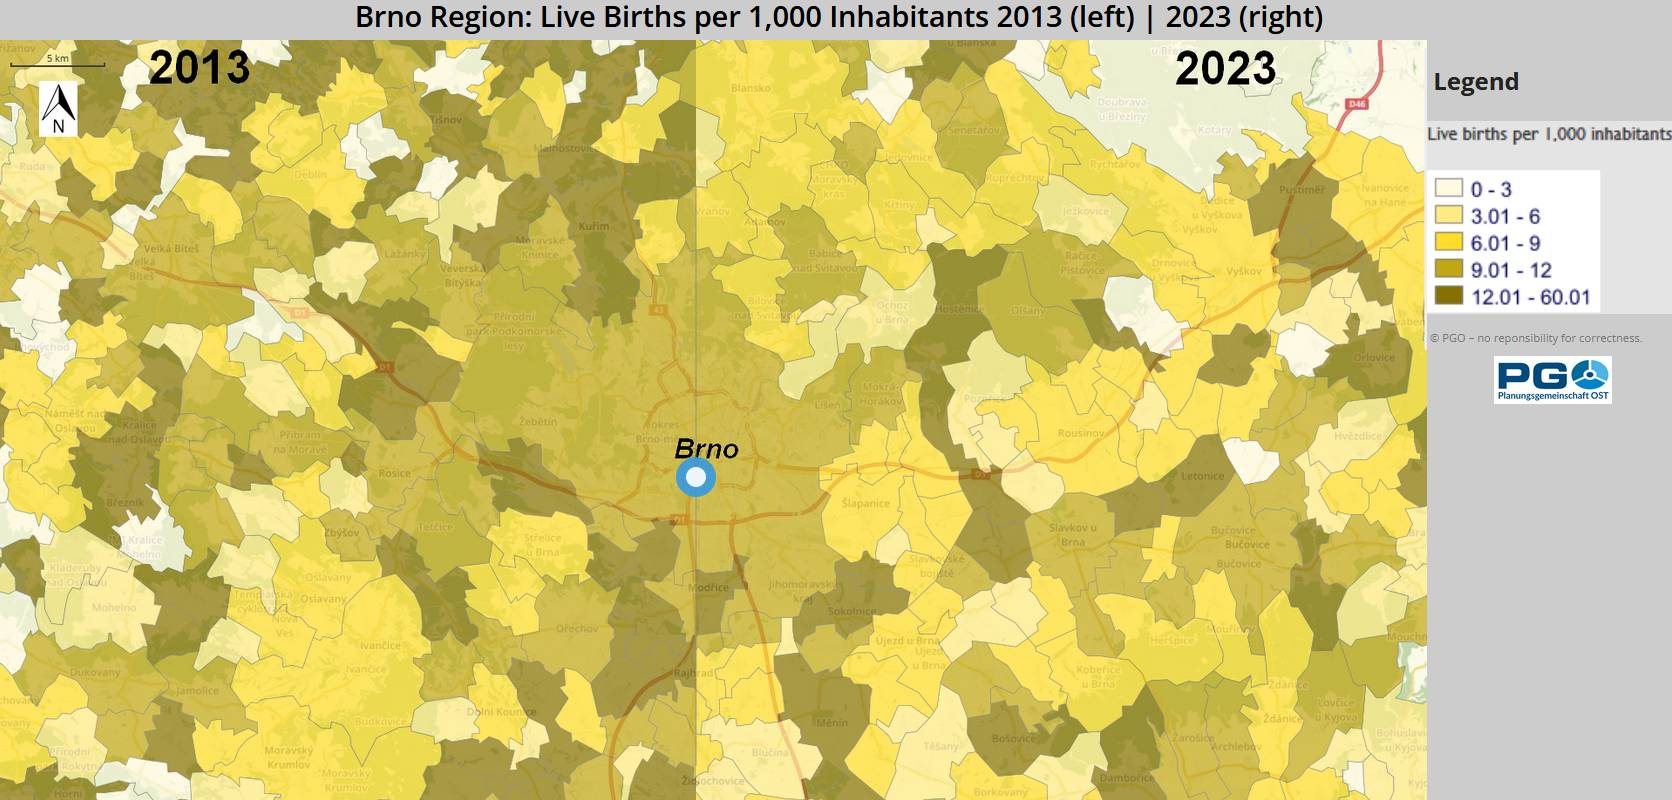
1 June is the International Day of Parents. On this occasion, we are taking a look at the development of the birth rate (live births per 1,000 inhabitants) in the Centrope region. The slider maps compare the years 2013 and 2023. In average, the numbers are lower for 2023 throughout the whole region. This could simply be a classic statistical outlier, as the lockdowns during the coronavirus pandemic led to a temporary rise in the birth rate, which in the following years caused saturation effects resulting in lower numbers of births. Open Map for Vienna-Bratislava region Open Map for Seewinkel-Győr region Open Map for České Budějovice region Open Map for Brno region

 Chart of the month July
 On the occasion of World Population Day, celebrated on 11 July, we are taking a look at the population development in the Centrope countries. The timeseries shows the development since 2016. Due to the differnt population size in each country, we indexed the numbers to 2016 = 100 for a better comparison. The chart shows different trends in each country: Whereas the overall population in Hungary and Slovakia is shrinking, there are increasing numbers in the Czech Republic and in Austria. The EU-27 average shows a very small increase through the decade displayed.
Data source: https://ec.europa.eu/eurostat/databrowser/view/demo_pjan/default/table
On the occasion of World Population Day, celebrated on 11 July, we are taking a look at the population development in the Centrope countries. The timeseries shows the development since 2016. Due to the differnt population size in each country, we indexed the numbers to 2016 = 100 for a better comparison. The chart shows different trends in each country: Whereas the overall population in Hungary and Slovakia is shrinking, there are increasing numbers in the Czech Republic and in Austria. The EU-27 average shows a very small increase through the decade displayed.
Data source: https://ec.europa.eu/eurostat/databrowser/view/demo_pjan/default/table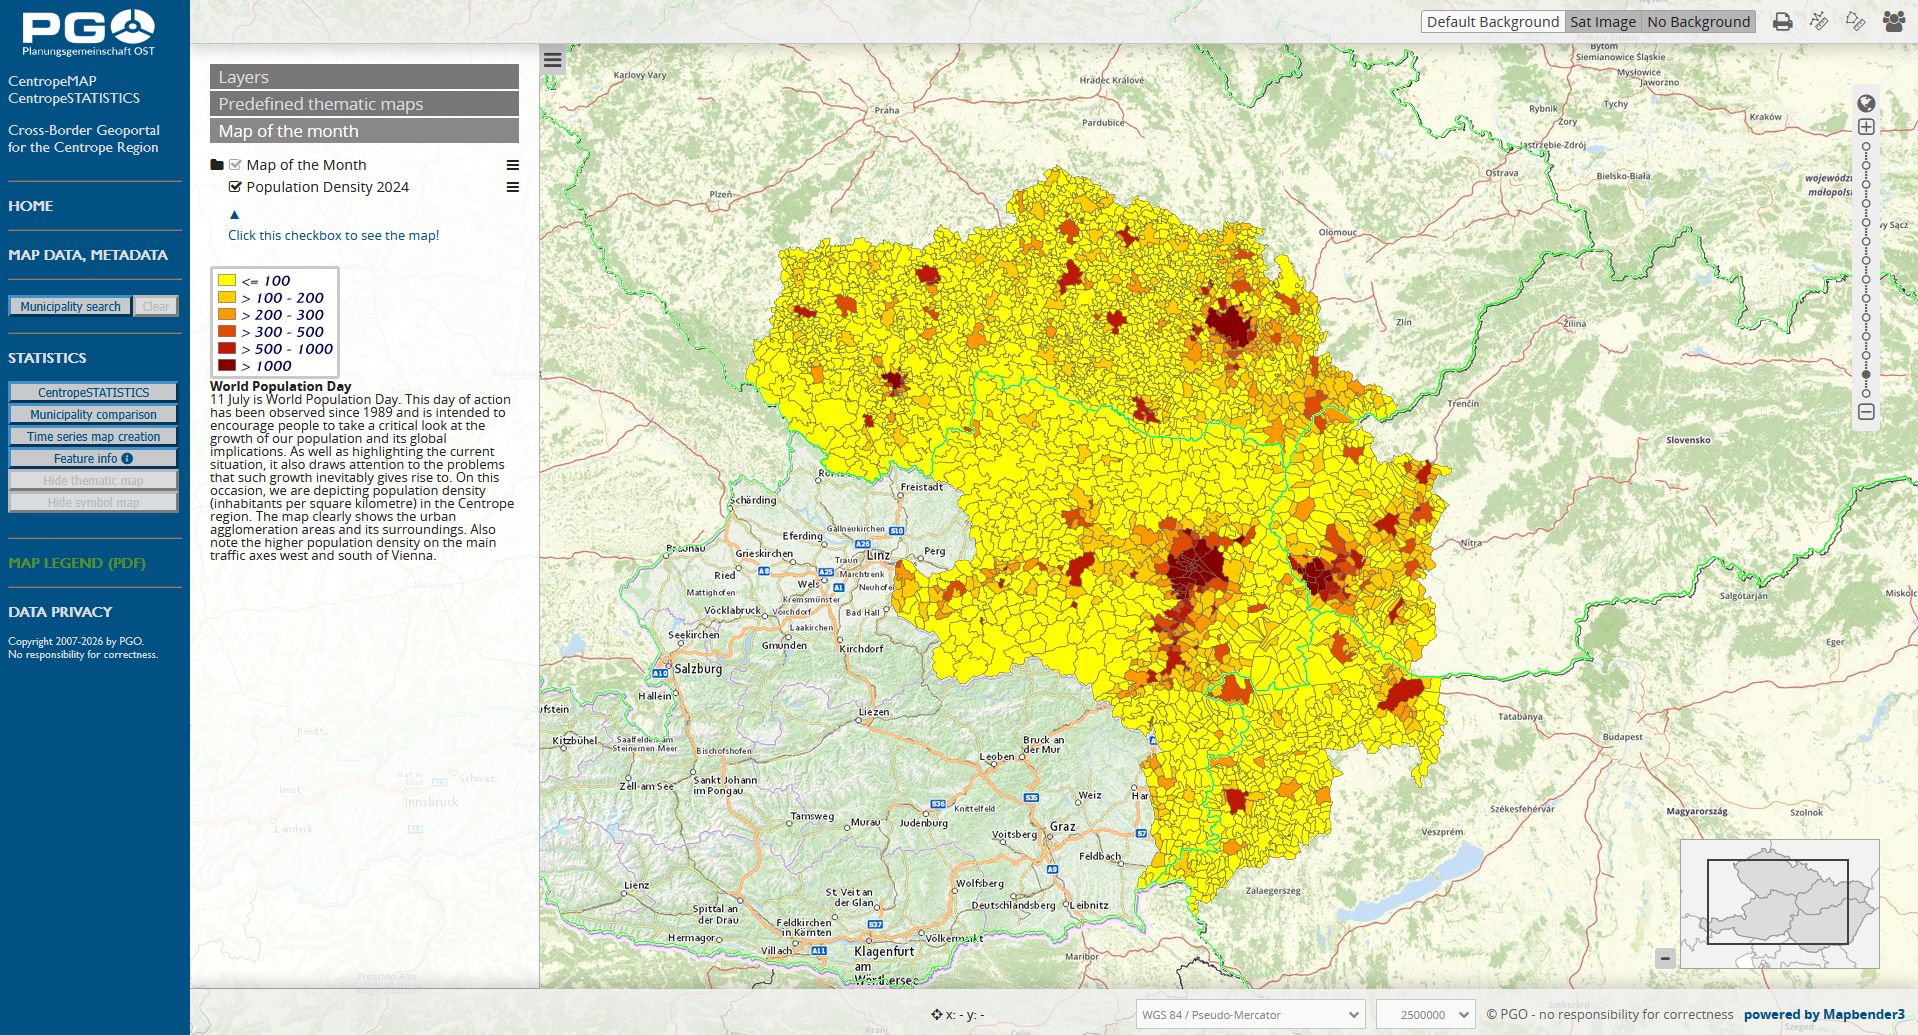 11 July is World Population Day. This day of action has been observed since 1989 and is intended to encourage people to take a critical look at the growth of our population and its global implications. As well as highlighting the current situation, it also draws attention to the problems that such growth inevitably gives rise to. On this occasion, we are depicting population density (inhabitants per square kilometre) in the Centrope region. The map clearly shows the urban agglomeration areas and its surroundings. Also note the higher population density on the main traffic axes west and south of Vienna.
 Chart of the month June